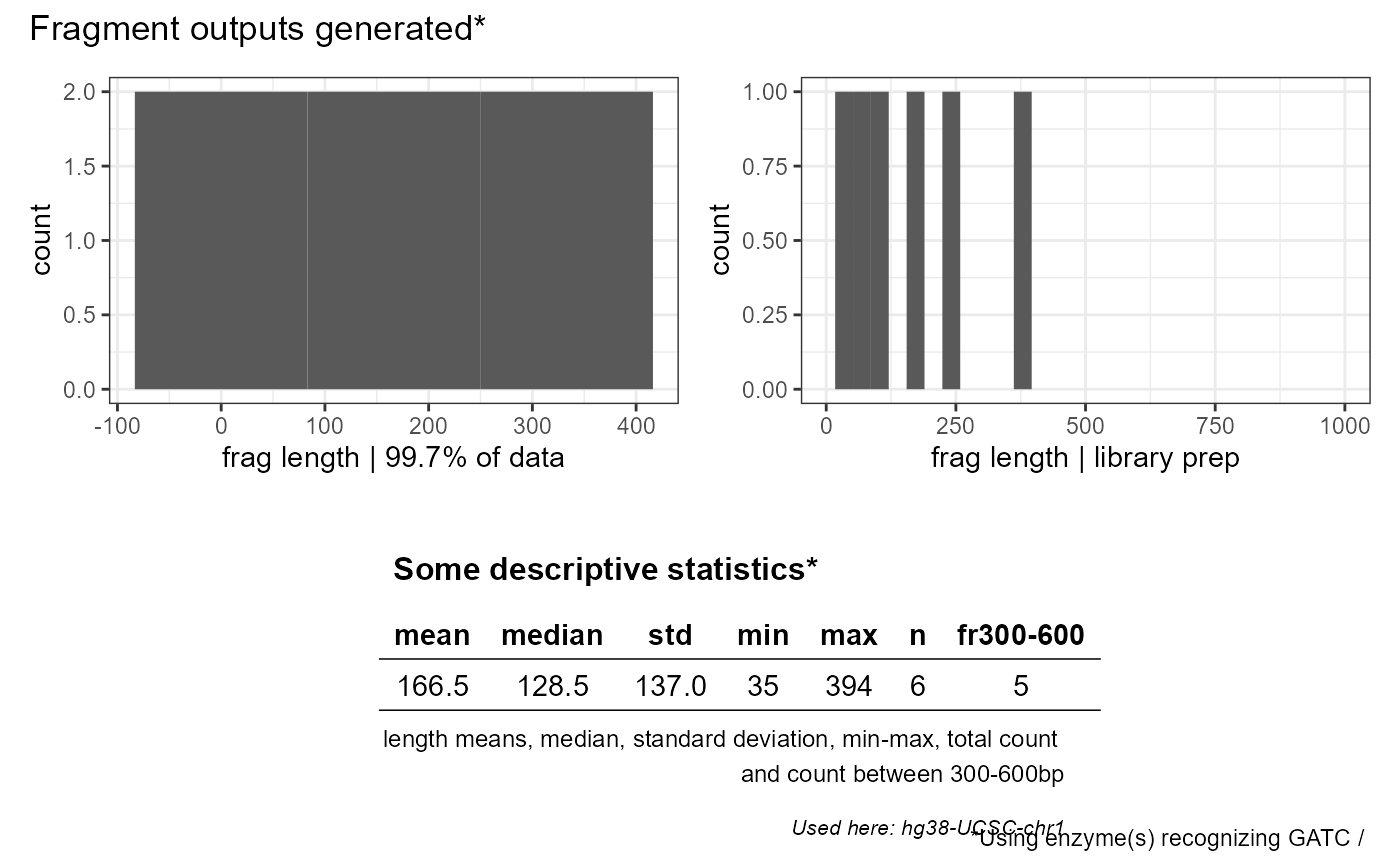
Plot the saved vector (fragment length) outputs generated with FROG_pal, FROG_nonpal or FROG_mix
Source:R/FROG_plot.R
FROG_plot.RdPlot the saved vector (fragment length) outputs generated with FROG_pal, FROG_nonpal or FROG_mix
Arguments
- x,
Saved output from FROG_pal, FROG_nonpal or FROG_mix (alternatively, an integer vector)
- pattern1,
Pattern1 used for digesting the DNAString
- pattern2,
Pattern2 used for digesting the DNAString
Examples
library(FROGmentator)
my_DNA<-gen_DNA(1000)
pattern1<-'GATC'
FROG_pal_output<-FROG_pal(my_DNA, pattern1)
FROG_plot(FROG_pal_output, pattern1)
#> `stat_bin()` using `bins = 30`. Pick better value with `binwidth`.
#> Warning: Removed 2 rows containing missing values (`geom_bar()`).