Single-cell Vector Copy Number Variation Analyses
When working with integrating vectors such as retroviruses and lentiviruses, it is essential to determine the copy number of cargo genes inserted into the host’s genome following infection. Screening a cell population with droplet digital PCR for a cargo gene and normalizing its signal to a housekeeping gene provides an estimate of the average number of cargo-gene copies across the population. However, this approach only gives average values and does not account for the distribution of vector integration events. This means we lack critical insights into how much of the population has more than one copy of the cargo gene or none at all. For example, while the average number of integrations might be determined as one per genome, the proportions of cells with 0, 1, or more copies remain unknown (see image below).
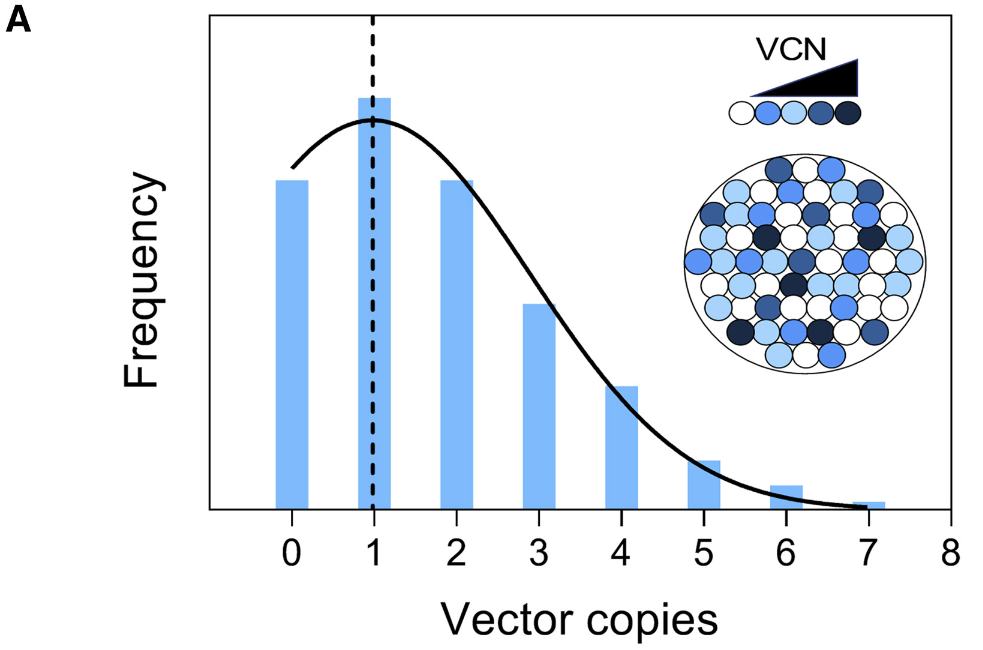 source: Santeramo et al., 2020
A study by Santeramo et al., 2020 addressed this limitation by devising an alternative strategy to characterize the distribution of gene insertions in the transduced population. Using a pre-amplification ddPCR protocol, they quantified the number of gene copies at the single-cell level (using single-cell lysates; n=422). This data was then used to develop an in-house Bayesian model that predicted the population structure based on single-cell gene copy numbers. For instance, in a sample with an average of 1.46 gene copies per cell, the model revealed that approximately 64% of cells had one copy, 23% had two copies, 5% had three copies, and 3% had four copies.
This study demonstrates that combining single-cell ddPCR protocols with statistical modeling can provide crucial insights into the frequency of extreme vector integration events. Such data cannot be obtained through bulk population analysis alone.