Establishing Limit of Blank/Detection/Quantification for Your Assay(s)
To ensure the robustness and reliability of your ddPCR assay, it is critical to define and validate key analytical parameters, such as the Limit of Blank (LoB), Limit of Detection (LoD), and Limit of Quantification (LoQ). These metrics are foundational for accurate assay interpretation, particularly in applications such as rare mutation detection, pathogen quantification, or low-abundance target analysis.
This brief entry provides step-by-step guidelines for determining these limits, following general best practices. Let’s begin with some definitions first:
- Limit of Blank (LoB): The highest apparent concentration of target sequence measured in a sample that does not contain the target sequence (NTC). LoB establishes the assay’s background signal (and the presence of any false positive(s)).
- Limit of Detection (LoD): The lowest concentration of the target sequence that can be reliably distinguished from the LoB, with a predefined probability of detection.
- Limit of Quantification (LoQ): The lowest concentration of the target sequence that can be quantified with acceptable, predetermined variance, or coefficient of variation (CV*) (e.g. 20%).
In order to establish LoB, do the following:
- Run your ddPCR assay with (e.g., 20) NTC replicates
-
Calculate the LoB using the formula:
LoB=MeanNTC+1.645×SDNTC
Where:
MeanNTC - Mean target concentration in NTC (blank) replicates
SDNTC - Standard deviation of target in NTC (blank) replicates
For the LoD, the following can be done:
- Since, LoD is calculated by utilizing the measured LoB and testing replicates with a low concentration of the target, you can create serial dilutions of the target sequence (using a positive control, e.g. gBlock) around the anticipated LoD. Make sure to include at least 3 concentrations near the threshold and run multiple replicates (e.g., 20).
-
Calculate the LoD using the formula below:
LoD = LoB + 1.645xSDlow concentration of target
Where:
LoB - previously established LoB for this assay
SDlow concentration of target - standard deviation in samples with low concentrations of the target sequence
The easiest way to determine the LoD of your particular assay is to plot the fraction of positive replicates (0-100%) against the measured average concentration values of your target in your replicates (eg., 0, 1, 10, 100 cp/ul …), similarly to what’s described by Kubista et al., 2026:
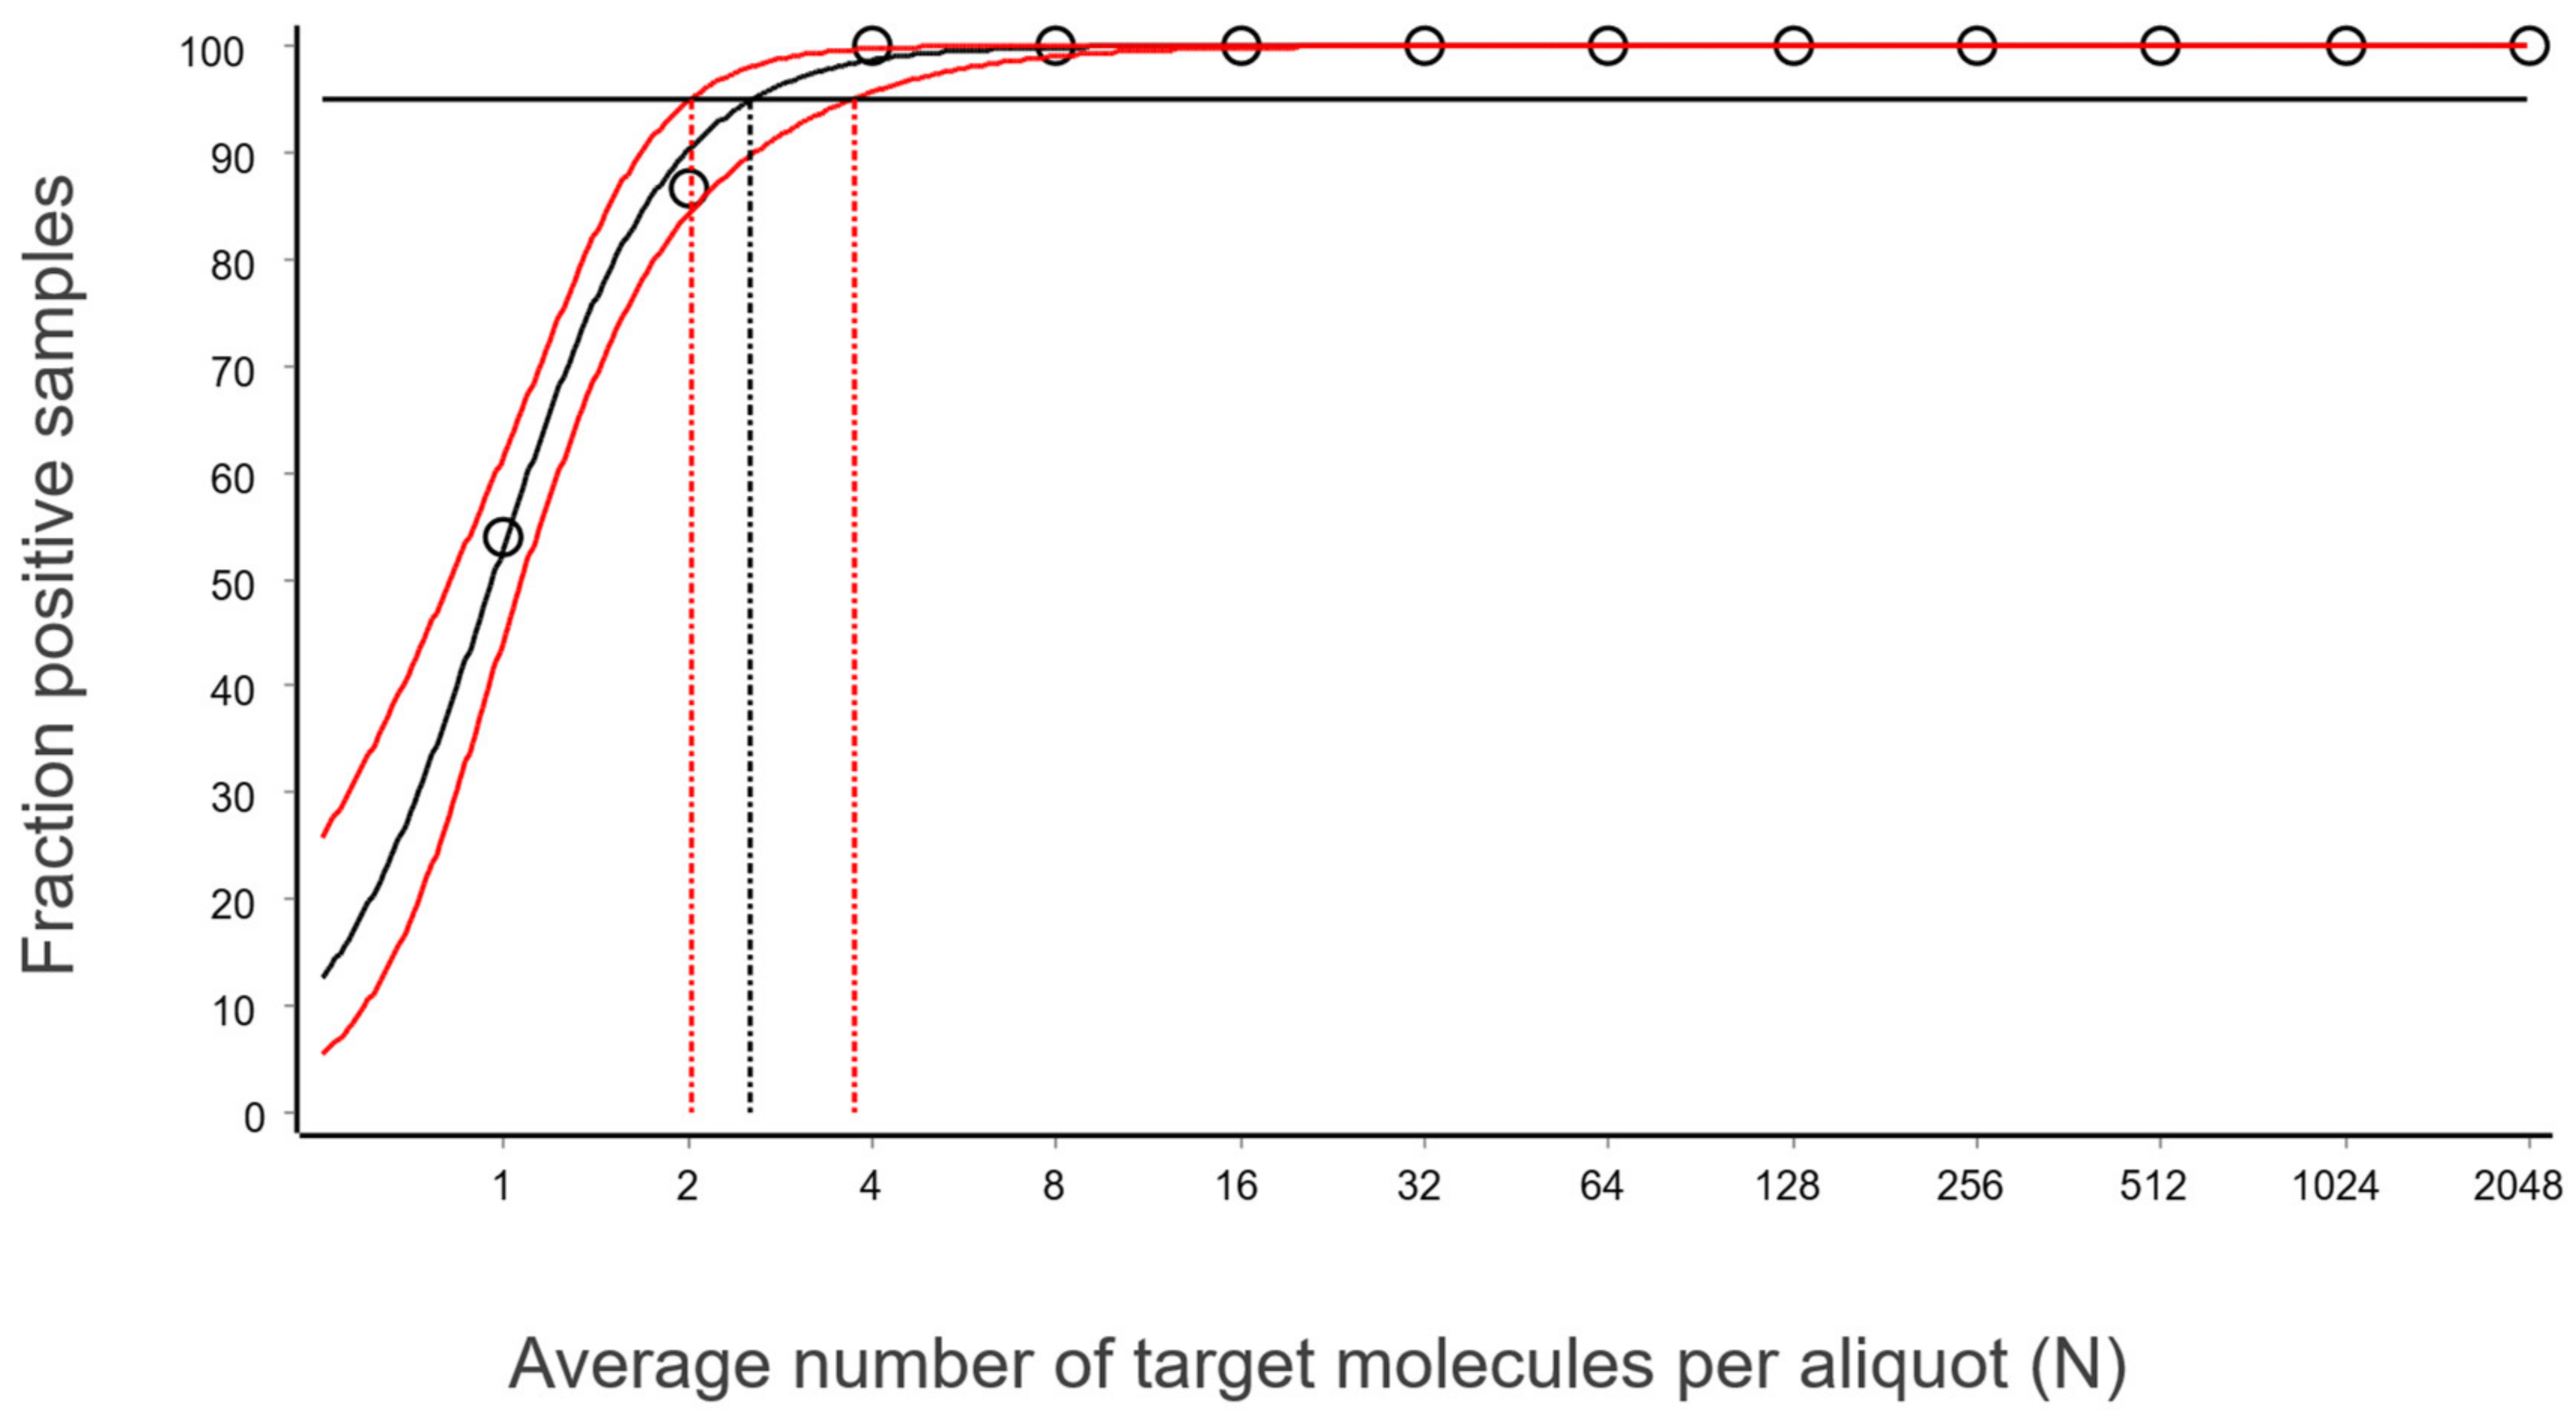
source: Kubista et al., 2026, Figure 8
From here, LoD is simply the concentration of target molecules/ul (X axis) that corresponds to the detection rate of >95% (Y-axis).
For the LoQ, you can do the following:
Firstly - the LoQ can range from being equivalent to the LoD to a much higher concentration value but is never lower than the LoD. Using the previous dilution experiment to establish the LoD, you can identify the concentration at which the precision, typically expressed as %CV*, is equal or below to a predetermined value - e.g., 20%.
The exact procedure of determining the LoQ can, once again, be based on simply plotting the %CV in the different dilutions (i.e. between the replicates of each dilution group; Y axis) against the average target copy numbers for every dilution category (0, 1, 10, 100 cp/ul …; X axis). At that point, determining the cut-off point at 20% %CV (Y-axis) and finding the input concentration at which the LoQ for your assay resides should be fairly trivial.
* CV is calculated (for each dilution) by dividing the standard deviation by the mean concentration of the target sequence in your replicates.
EXAMPLE: let’s imagine that for dilution X, you consistently get around 10 copies/ul of the target sequence. Your standard deviation is 0.4 copies/ul. Then, %CV = (0.4/10) * 100% = 4 %.
The image below summarizes the differences between LoB, LoD and LoQ and what each of these parameters represent. For more info, you can also refer to this Bio-Rad Bulletin 7183 Ver A or have a look at the study published by Forootan et al., 2017.
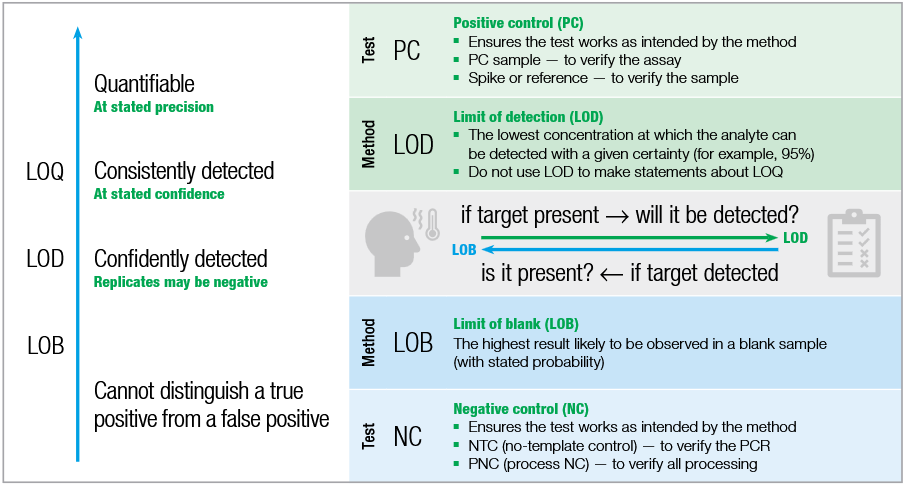 source: Bio-Rad Bulletin 3674